
Introduction
With Tachyon TNA metrics already flowing into Prometheus (see Monitoring Tachyon TNA Devices with Prometheus and Alertmanager via SNMP), the next step is making that data usable day-to-day. Prometheus' built-in query UI is sufficient for spot-checks and debugging, but it isn't built for at-a-glance monitoring, historical comparison, or sharing status with a wider team.
Grafana fills that gap. This guide covers installing Grafana, connecting it to an existing Prometheus instance, and building a dashboard that surfaces the metrics most relevant to TNA operation: wireless link quality (SNR, RX power), device temperature, and Ethernet port status — turning raw SNMP data into a single view suitable for daily monitoring or NOC use.
Configuration
- Install Grafana
- Add Prometheus as a Data Source
- Create the Dashboard
- Create a single dashboard — "Tachyon TNA — Device Overview"— containing the following panels. Keeping all metrics in one dashboard, rather than one per metric, keeps the time range and refresh in sync across the full device view.
- Panel: Wireless Link SNR
Metric: selecttachyonWirelessPeerSnr
Visualization: Time series. Legend:{{wirelessPeerName}} ({{wirelessPeerMac}}). - Panel: Wireless RX Power
Metric: selecttachyonWirelessPeerRxPower
Visualization: Time series. Unit: Field → Standard options → Unit → Custom unit →dBm.
Legend:{{wirelessPeerName}} ({{wirelessPeerMac}}). - Panel: Device Temperature
Metric: selecttachyonWirelessRadioTemperature
Visualization: Time series. Unit: Celsius (°C). Add a threshold line at60, matching the alerting rule from the Prometheus guide.
- Panel: Wireless Link SNR
- Save.
Verification
Confirm the dashboard reflects live data before considering the setup complete.
Open the dashboard and confirm each panel renders data rather than showing "No data":
- Wireless Link SNR and RX Power — one line per peer, matching the MAC addresses seen in Prometheus
- Device Temperature — one line within the expected 0–60°C range.
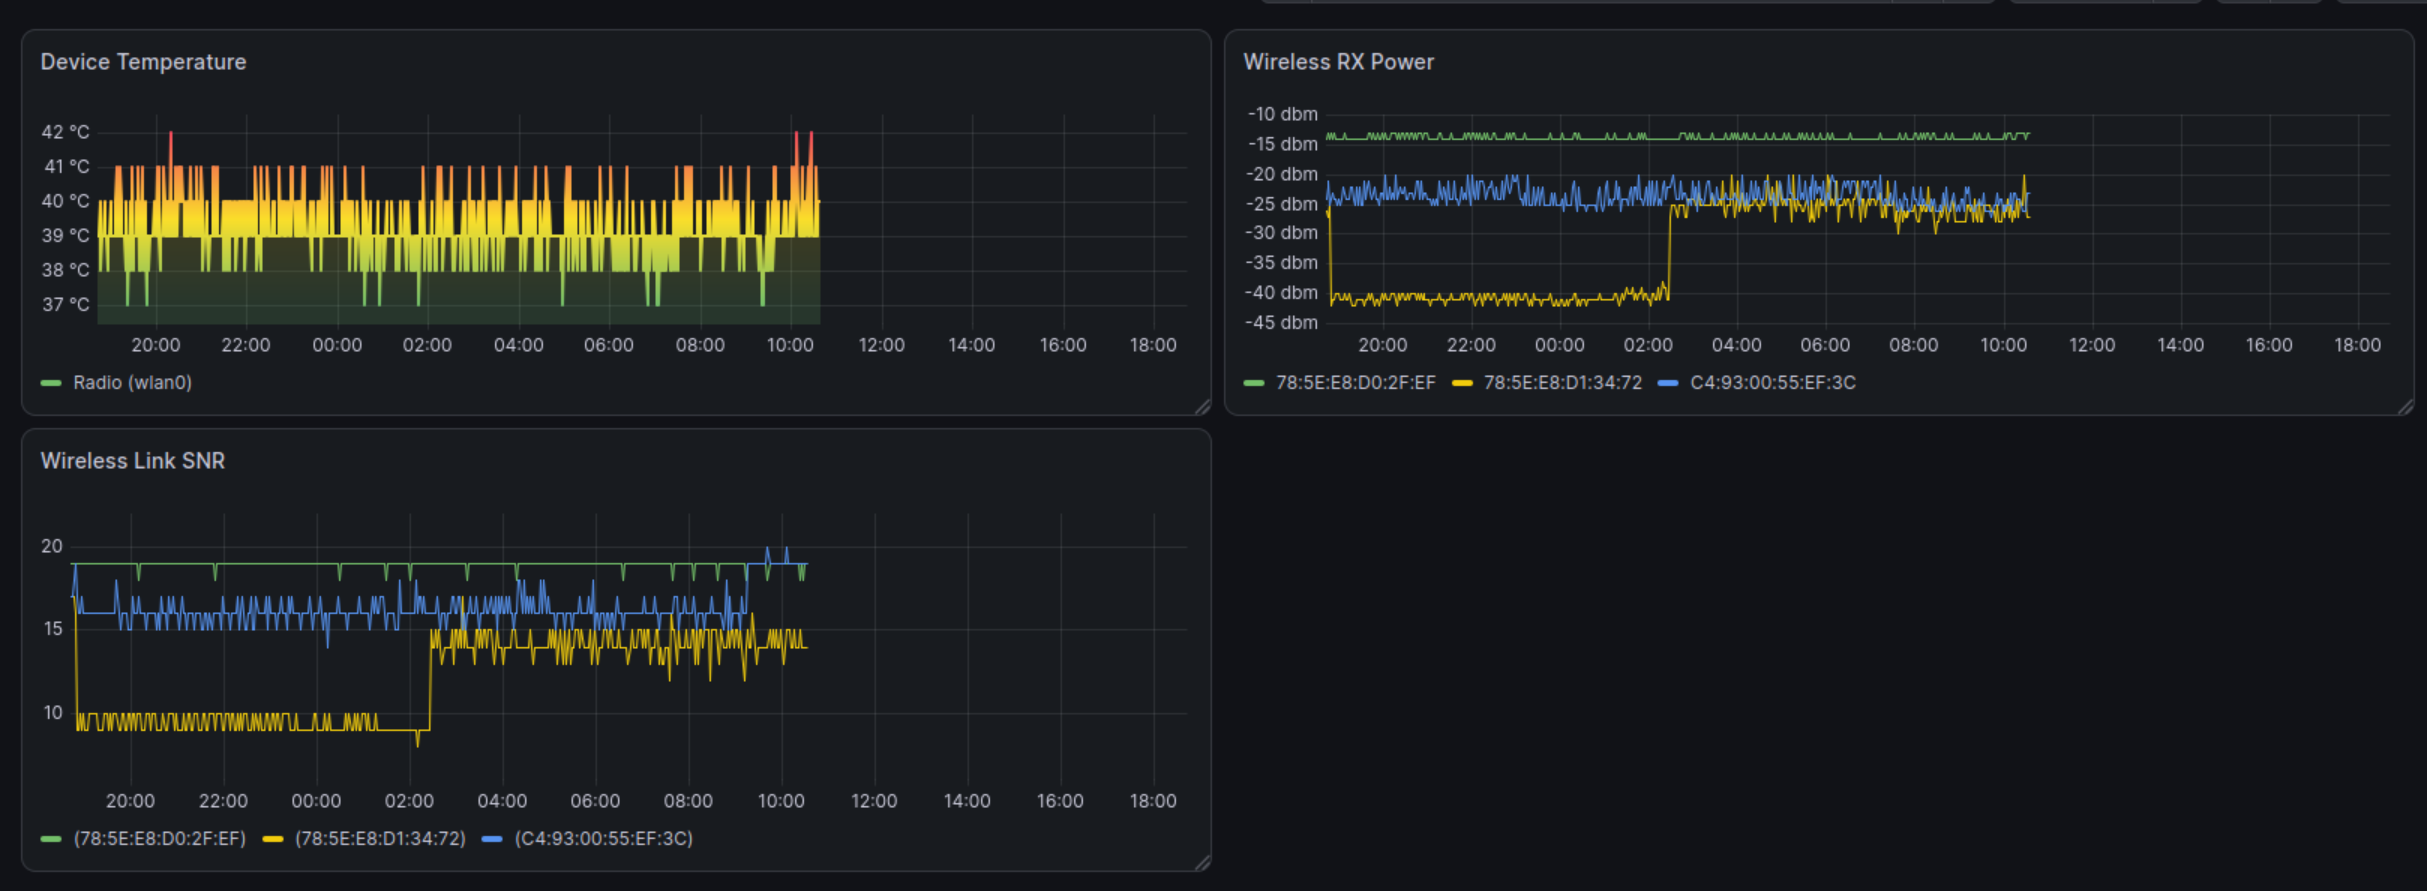
Note: The panels shown above cover the metrics most relevant to day-to-day monitoring, but they are illustrative examples. The tachyon SNMP module exposes the full range of metrics supported by the device — Ethernet ports, wireless radios, VAPs, peers, and system health — any of which can be added to this dashboard using the same panel creation process.