
Introduction
Tachyon Networks' TNA series (TNA-300 / TNA-305X) is used across diverse deployments — wireless backhaul, point-to-multipoint access, and hybrid wired/wireless links — often running unattended in outdoor or remote sites. This flexibility means a single device carries several failure-critical parameters at once: wireless link quality (SNR, RX power), device temperature, and Ethernet uplink state. Left unmonitored, degradation in any of these typically surfaces only after service is already affected.
This guide integrates TNA devices into Prometheus and Alertmanager via SNMP, polling the vendor TACHYON-MIB alongside standard interface counters, and alerting on key thresholds before marginal conditions become outages.
Configuration
Prerequisites
- Ubuntu server with Prometheus,
snmp_exporter, and Alertmanager installed as systemd services - SNMPv2c enabled on the TNA device, with a known community string
- Network reachability between the Prometheus host and the TNA device(192.168.1.20) on UDP/161
- SNMP Exporter Module
TNA devices expose metrics via the vendor TACHYON-MIB (OID base 1.3.6.1.4.1.57344), covering Ethernet ports, wireless radios/VAPs/peers, and system health (CPU, memory, temperature, uptime).
Add a tachyon module to /etc/prometheus/snmp.yml:
auths:
  public_v2:
    version: 2
    community: public   # replace with your actual community string

modules:
  tachyon:
    walk:
      - 1.3.6.1.4.1.57344.1.1   # ethernet
      - 1.3.6.1.4.1.57344.1.2   # wireless
      - 1.3.6.1.4.1.57344.1.3   # system-ext
    metrics:
      - name: tachyonWirelessPeerSnr
        oid: 1.3.6.1.4.1.57344.1.2.6.1.8
        type: gauge
        help: Peer's signal-to-noise ratio (SNR)
        indexes:
          - labelname: wirelessPeerIndex
            type: gauge
        lookups:
          - labels: [wirelessPeerIndex]
            oid: 1.3.6.1.4.1.57344.1.2.6.1.1
            labelname: wirelessPeerMac
            type: DisplayString
      # ... remaining metrics follow the same pattern
      # (full module: 37 metrics covering ethernet, radio, VAP, peer, and system groups)
Verify the exporter returns data before wiring it into Prometheus:
curl 'http://localhost:9116/snmp?target=192.168.1.20&module=tachyon'
Add a scrape job in /etc/prometheus/prometheus.yml, using snmp_exporter as an intermediary target:
scrape_configs:
  - job_name: "tachyon-tna302"
    scrape_interval: 30s
    static_configs:
      - targets:
          - <device-ip>
    metrics_path: /snmp
    params:
      module: [tachyon]
    relabel_configs:
      - source_labels: [__address__]
        target_label: __param_target
      - source_labels: [__param_target]
        target_label: instance
      - target_label: __address__
        replacement: localhost:9116

rule_files:
  - "alerts.yml"

alerting:
  alertmanagers:
    - static_configs:
        - targets: ["localhost:9093"]
Validate before reloading:
promtool check config /etc/prometheus/prometheus.yml
sudo systemctl restart prometheus
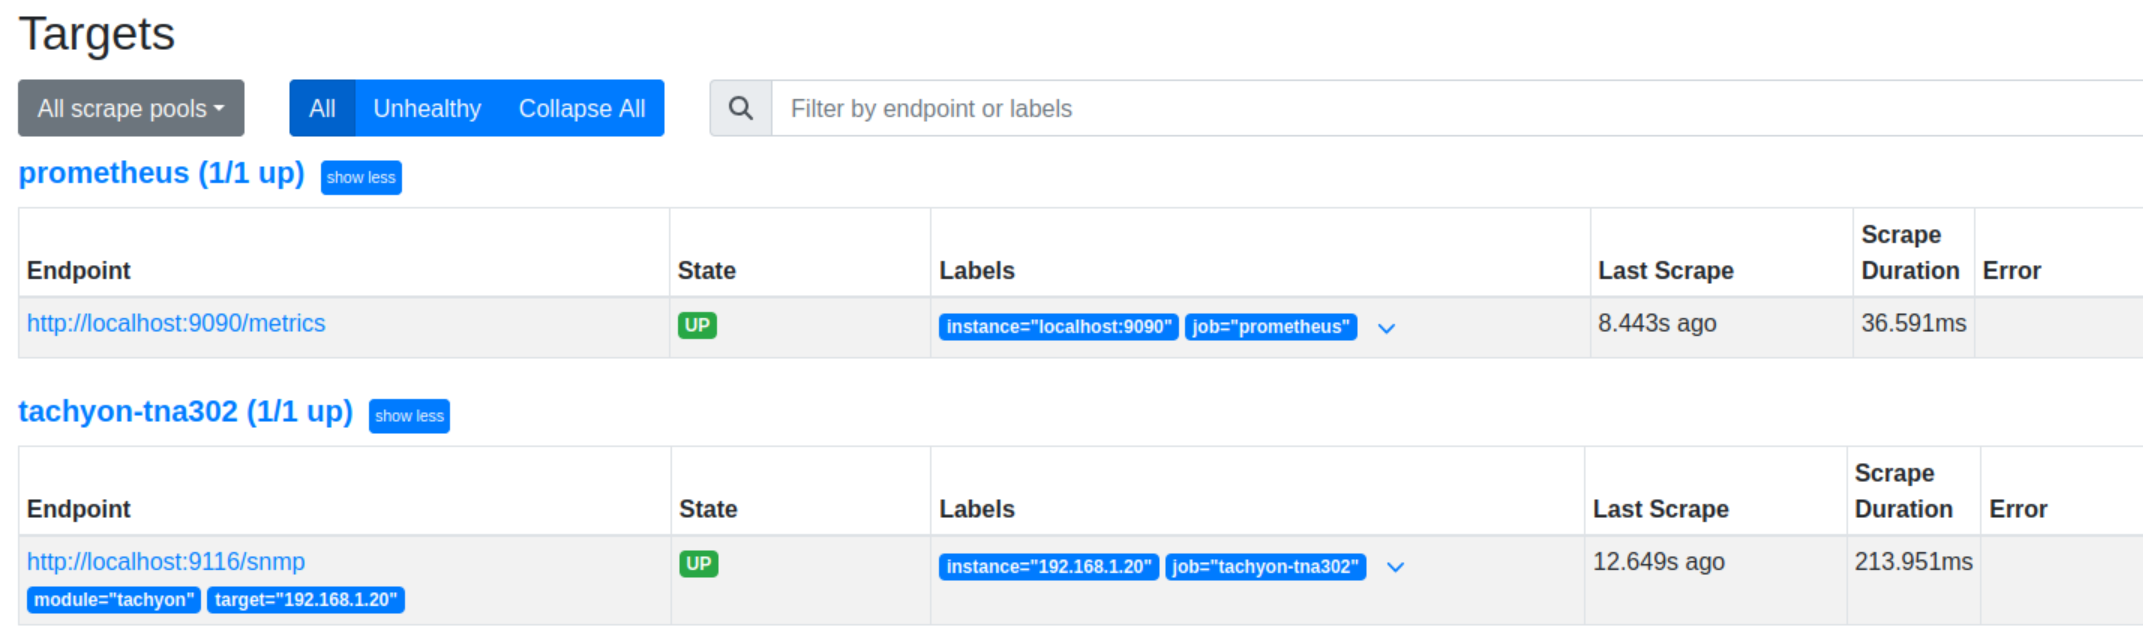
Confirm the target is UP at http://localhost:9090/targets
3. Alerting Rules
/etc/prometheus/alerts.yml defines threshold-based rules across four categories:
| Category | Example rule | Condition |
| Availability | TachyonDeviceDown | scrape failing for 2m |
| Temperature | TachyonCriticalCpuTemperature | CPU > 60°C for 2m |
| Wireless link | TachyonCriticalLinkSnr | SNR < 8 dB for 5m |
| Ethernet | TachyonEthernetPortDown | port enabled but link down for 2m |
groups:
  - name: tachyon_alerts
    rules:
      - alert: TachyonCriticalLinkSnr
        expr: tachyonWirelessPeerSnr < 8
        for: 5m
        labels:
          severity: critical
        annotations:
          summary: "Critically low SNR ({{ $value }} dB) on link to {{ $labels.wirelessPeerName }}"
      # ... remaining 12 rules
One rule above illustrates the pattern; the remaining 12 rules (availability, memory, Ethernet port state, RX power, link flapping, etc.) follow the same structure and must be added to alerts.yml
Validate:
promtool check rules /etc/prometheus/alerts.yml
SNR/RSSI thresholds above are generic baselines for PtMP links; tune them against the device's observed operating range before relying on them in production.
Verification
Before relying on the ruleset, confirm each layer of the pipeline independently.
- Prometheus → data ingestion
Open http://localhost:9090/graph, enter the following in the query field, and click Execute:
tachyonWirelessPeerSnr
Switch to the Table tab (not Graph) to see current values immediately. Each wireless peer should appear as a separate row, labeled with wirelessPeerMac and (where available) wirelessPeerName — for example:
tachyonWirelessPeerSnr{instance="192.168.1.20", wirelessPeerMac="78:5E:E8:D0:2F:EF"}  19
tachyonWirelessPeerSnr{instance="192.168.1.20", wirelessPeerMac="78:5E:E8:D1:34:72"}  16
tachyonWirelessPeerSnr{instance="192.168.1.20", wirelessPeerMac="C4:93:00:55:EF:3C"} 17tachyon into the query field should trigger an autocomplete dropdown listing all available metric names as a sanity check.If the query returns no results, confirm the metric name is spelled exactly as shown (Prometheus queries are case-sensitive) — typing tachyon into the query field should trigger an autocomplete dropdown listing all available metric names as a sanity check.
2. Graphical visualization
Switching to the Graph tab renders each labeled series as a separate line over the selected time window:
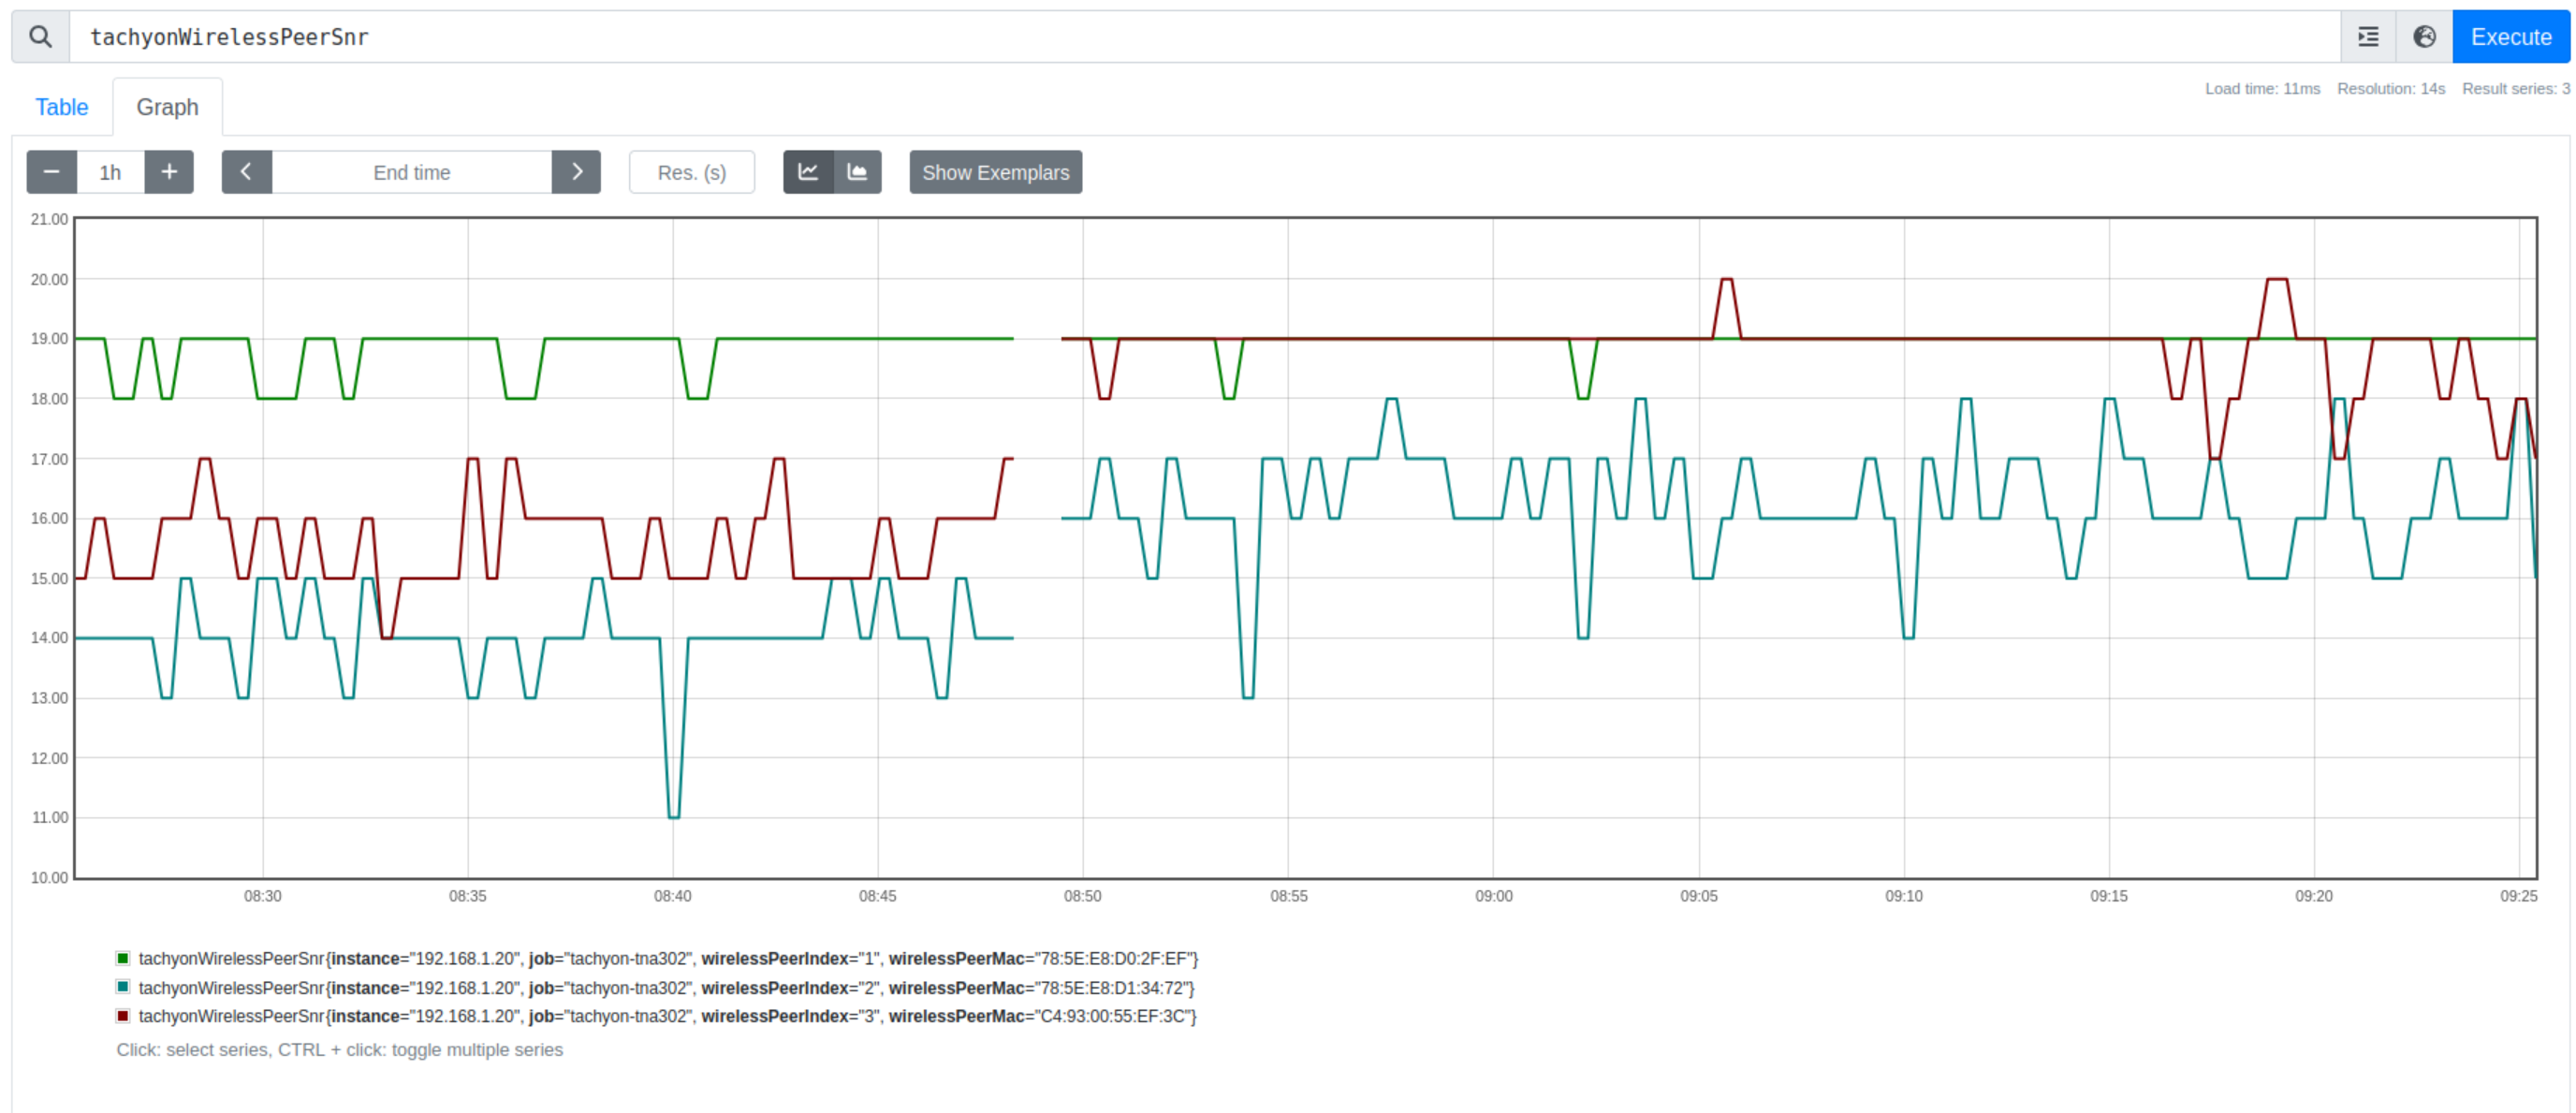
Each series is automatically color-coded and labeled by its full label set — here, three distinct wireless peers (wirelessPeerMac) tracked over roughly one hour, with SNR fluctuating between 11–20 dB. This step-like pattern is expected for a 30-second scrape interval; short dips (e.g., peer 2 dropping to 11 dB around 08:40) are visible immediately, which is precisely the kind of transient degradation the TachyonWeakLinkSnr and TachyonCriticalLinkSnr rules are designed to catch if sustained beyond their for duration.
Use the time range control (top-left, default 1h) to widen the window when investigating a historical alert, or narrow it to inspect recent behavior in more detail.
Possible Extensions
This configuration provides a working baseline for a single TNA device. The following are optional directions worth considering, available on request, depending on deployment scale and operational needs:
- Notification routing — Alertmanager configuration (email, Slack, Telegram) so firing alerts are delivered proactively rather than requiring manual checks of the
/alertspage. - Grafana dashboards — long-term visualization and historical trend analysis on top of this Prometheus setup.
- Fleet-wide monitoring — service discovery-based configuration for multiple TNA devices, replacing manual per-device entries in
prometheus.yml. - Per-site threshold tuning — adjusting SNR, RSSI, and temperature thresholds to each link's actual operating conditions rather than the generic baseline used here.
- Severity-based alert routing — separating critical and warning-level notifications to different channels or escalation paths.
- Long-term data retention — extending storage beyond Prometheus' default local retention for multi-device historical analysis.