This version of the TNA-300 series Web UI manual applies to firmware versions v1.15.0 and later for most TNA-300 series models. You can find the current firmware version of your device on the Dashboard page, within the System information widget. For the TNA-305 product models, please go here.
Please refer to your device's Operating Manual for information about how to power your device, what the device LEDs mean, aiming tips, and other useful information.
Table of contents
> Reboot
Login & access

i Note: If you change networks during configuration and your laptop receives a new IP, you will be prompted to login to the web UI again.
Please refer to login instructions included in the the operating of your specific TNA model.
! Change the device's default user credentials after you log in for the first time.
Dashboard
The device dashboard shows the overall status of your device, including:
- System information
- Wireless status information
- Ethernet port link and PoE (where applicable) status
- Failover status (where applicable)
- Networking details (including management and/or data VLAN) for the local bridge interface(s)
- Traffic graphs for the wireless and ethernet interfaces
- System resources, including cpu usage, memory usage, and device temperatures

System Information
This section will show you information about your device, including:
- Device name, location, and hostname: device name is used to populate LLDP discovery fields, and the hostname will be used when sending DHCP requests.
- The firmware versions running on each device bootbank (active and alternate/backup).
- 60GHz driver and antenna config versions: these fields are mainly used for debug purposes.
- Current system time: this is the device's current date and time. Timezone (where applicable) and other time settings are configurable from the System settings page.
Note: The 303L does not support timezones so this field will always represent UTC. - Device model and antenna kit: The device's antenna kit can be configured under Wireless settings and is used to determine the estimated target RSSI of any connected peers.
Note: antenna kits are currently supported for TNA-303X models only. - Device uptime since last reboot.
Firmware version notifier
The device will check for new firmwares once a day. When one is available, you'll see a link to download the firmware appear in the upper right corner of the System information widget:

If the device cannot contact https://tachyon-networks.com, you'll see a message like this:

If you don't see a firmware version message at all, your firmware may not support this feature, or the device encountered a system error.
60GHz Wireless Status
The image below shows an example of what the wireless status will look like in station/client or point-to-point slave mode (click to make the image larger).

And here's the wireless status section of the dashboard when the device is operating in AP mode or point-to-point master (point-to-point master will only have a single client connected):

You can kick an associated client off of a device operating in AP mode by clicking the "three dot" menu at the right end of the row, and selecting "Kick client". This can be useful when using station connection profiles to force your station to connect to a different AP.

To view the wireless throughput graph, click on the upper right corner of the wireless widget on the dashboard:

Connected Peer Stats
- IP Address, peer name, firmware version, and model: A connected device's management IP, name, and other details will be shown once discovery/LLDP data is available for the peer, which may take a few minutes after association. If the discovery or LLDP services are disabled on either side of the link, then discovery data (including IP, device name, model and fw version) will be not be available.
- Target RSSI: Target RSSI is an estimate of the best-case RSSI for the link, given the device models detected on either side of the link, as well as the link distance. Actual RSSI may differ from target depending on environment factors, beam location, etc... This field will not be populated if device models are not recognized (e.g. if LLDP is disabled on either side of the link).
- Packets/MCS Datarate chart: The system observes a client's traffic during the 5 minute interval, and determines how many packets were sent for each MCS rate. Lower MCS rates have a lighter yellow color, and gradually turn a darker blue the higher the rate. When clients first connect, you'll see that lower MCS rates are being used, and then when traffic increases over the link, the number of packets in the upper MCS rates will grow.
- Packets/ TX Retry bucket chart: The system also checks to see how many packets were retried across the wireless link during the observational period, and categorizes them into buckets based on the number of retries. If you have many packets outside of the "green" bucket, check your link for obstructions. If there are none, you might have an environmental issue with reflections.
- Link Availability: This section shows how much rain the link can withstand at MCS1 before it will go down.
- Sector IDs: You can read more about TNA-300 series sector IDs here. A connected peer's sector ID can now be visualized on the Sector Info Tool.
Note: The connected client charts "Packets/MCS Datarate" and "Packets/TX Retry Bucket" will show up only after the client has been connected at least 5 minutes. Data for these charts are collected for a 5 minute interval, and then pushed to the UI. The data is not cumulative across the lifespan of the link, only for the previous 5 minute duration.
Wireless Peer Speedtest
You can also perform a speed test by pressing the "Run" button near the TX or RX Speedtest labels next to a connected client in AP mode, or from the wireless status widget in Station mode. This can be used to test throughput between the AP and clients, or visa versa. It's useful to also rule out ethernet or other network issues when troubleshooting link performance.
Note: the speedtest tool pushes small burst of packets across a link, so running it will not have any noticeable effect on customer traffic, nor on the wireless throughput graph.
Compatibility note: Speedtest will not function between devices running firmware older than 1.15.0 are and devices running firmware 1.15.0 and greater.
2.4GHz Wireless Status
Compatibility note: this section only applies to devices support an internal or external USB-powered 2.4GHz management radio.
If your TNA model supports a management radio, the 2.4GHz radio status will be available on an additional tab in the main Wireless Status widget.

Ethernet Status
The ethernet status section of the dashboard includes:
- Traffic graphs
- Port status: link up/down, speed, etc
- PoE status (where supported)
- Failover status, when enabled
Under the three-dot actions button next to the Ethernet Status header, the following options are available:
- Bounce port: this will cause the eth0 port to go down and immediately come back up. A system activity event will be generated when this action is performed.
- Configure: this will take you to the Network Settings configuration page.

Configuration
i Only admin-level users have rights to access and change settings on the configuration pages of the web UI.
Applying configuration changes
While you're configuring your device, feel free to make changes to one or more settings located on any of the configuration pages mentioned in the sections below.

Once you're done, click the Save Now (1) button at the top of the page in order to write and apply the changes. Please note that your device will become temporarily unreachable while networking and other system services are restarted.
If you wish to discard your changes, refresh the page, or click the Discard (3) button.
If you wish to test your changes first, you can press the Test Changes (2) button, which will apply the current changes, and start a timer for 5 minutes.

After 5 minutes is up, if you haven't confirmed your changes, the will automatically roll back to the previous settings.
You can also view which changes are pending by clicking the list button to the left of the Save button.
Some settings changes will require a reboot to take place. In that case, you'll see an option to "Save & Reboot" but not to test your settings.
Network Settings
Compatibility note: As of firmware v1.12.0, the options on the networking settings page have been reorganized into multiple tabs.
/Device management & VLANs/Management & local networks

The top part of this tab contains an info box explaining how you will be able to access your device after the settings on this tab are applied, including VLANs (if using).
Networking mode
Compatibility note: Networking mode is only available in firmwares v1.12.4+ for TNA-303L models (including TNA-303L-65 and other variants). All other models operate in Bridge mode only. Also, config change via the API is not supported for client router-mode related settings. Please contact support if you'd like to request this as a new feature.
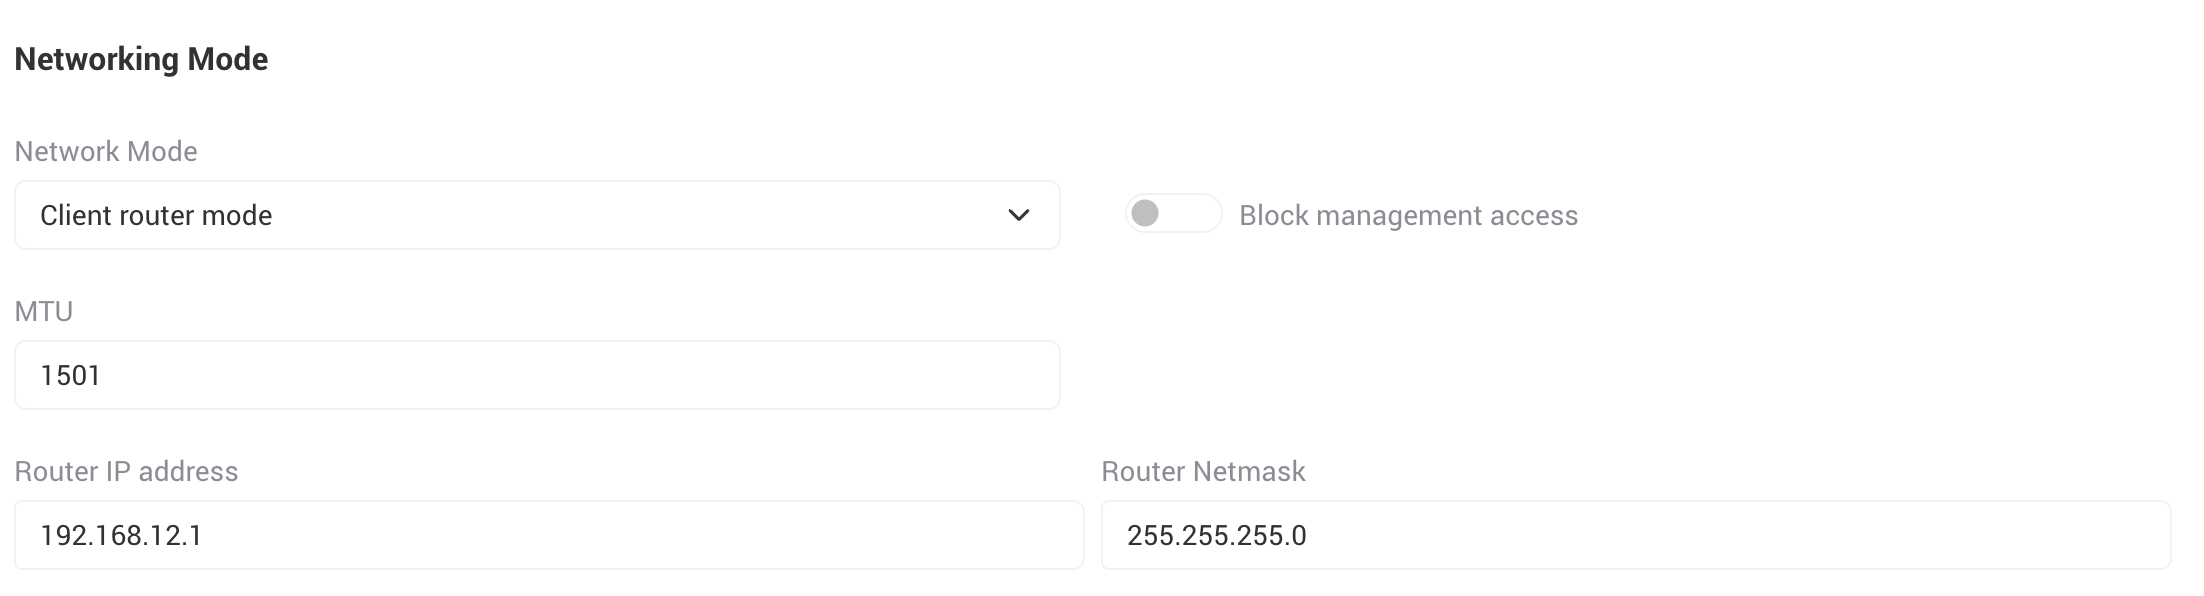
There are two options for the main device networking mode:
- Bridge: This is the default operating mode. The device will operate as a transparent L2 bridge. All interfaces are put in to the WAN bridge (br-wan).
- Client Router: This mode becomes available when the device's 60GHz wireless radio is operating in a client/station mode. This turns your device into a router that runs a DHCP server and routes between the WAN network (br-wan) and the local network (br-local).
When client router mode is selected, the following settings will become configurable:
- Block management access: When enabled, all access to the device's UI or management plane from the wired port(s) will be blocked. This means no access to the alternative access IP of 169.254.1.1. as well.
- MTU: Set the MTU (maximum transmission unit) of the new local, routed network br-local.
- Router IP address: Set the router's main IP address.
- Router Netmask: Set the router's netmask.
With DHCP server settings as well:
- Enabled: Whether the DHCP server should be enabled or not (support added in 1.15.0).
- IP range from: Select the first IP address in the DHCP server IP address pool.
- IP range to: Select the last IP address in the DHCP server IP address pool.
- DHCP lease time: Select how long DHCP-assigned lease should last before it's renewed or returned to the DHCP pool.
- DNS IPs: (optional) input your DNS IP addresses if required.
Note: DHCP entries can be made static from the Network Status widget on the device dashboard.
Management & local network settings
By default, the device is set to have its management IP (which is assigned on the WAN or br-wan network) assigned from an upstream DHCP server, and will fallback to 192.168.1.1 if no lease is provided.

Management IPv4 mode options: Static or DHCP client. These are applied to the management bridge of the device.
- DHCP client: If you choose DHCP client, you'll have the option of setting a fallback IPv4 address and netmask, custom DNS servers, and enabling DHCP broadcast (which requests DHCP broadcast replies from the DHCP server).
- Static IP: If you choose Static IP as the IP mode, you will need to manually set at least one IP (IPv4 or IPv6) for the device as shown below.

Enable Management VLAN: enable or disable management VLAN on the device. Once enabled, two local bridges/networks are created on the device - one management, and one data, each with its own set of IP address(es).
- Include ethernet in management VLAN: When this setting is enabled, the ethernet interface(s) are included in the management VLAN bridge along with the wireless interface. This setting is enabled by default for backwards compatibility. This value is only available in station mode.
- VLAN ID: ID in the range of 2 to 4094, and in firmware 1.12.0-beta-3 and later, you can also set management VLAN to 1. This is useful when enabling data VLAN and you want your device's management IP to come from the native network instead of the data VLAN'ed network.
- Mgmt VLAN Protocol: The default protocol/ethertype used for management VLAN is 802.1Q (0x8100) but as of firmware v1.12.1 and later support for 802.1ad (0x88a8) has been added in order to support QinQ applications.
- Enable static IP on data bridge: When this setting is enabled, you will be able to set an IPv4 static IP and netmask on the data bridge, giving one access to the local UI over the data network instead of the management VLAN network.
This can be helpful in the case where a tech needs to have upstream and downstream access to the device during installation over the non-management VLAN network. Once aiming and installation is complete, this setting can be turned off, only allowing access to the web UI over the management VLAN network.
Note: when data VLAN is enabled as well, the data bridge will become a part of the data VLAN network, and the data bridge static IP will not be accessible unless you are on the data VLAN'ed network.

/Device management & VLANs/Data VLAN

Data VLAN Protocol: The default protocol/Ethertype used for data VLAN is 802.1Q (0x8100) but as of firmware v1.12.1 and later support for 802.1ad (0x88a8) has been added in order to support QinQ applications.
Enable Data VLAN: When Data VLAN is enabled, traffic with the specified VLAN ID received over the upstream wireless link will have the VLAN tag removed as it exits the wired ports. Similarly, traffic coming into the device over the wired ports will be tagged with the specified VLAN ID when it's sent over the wireless link.
- This feature is only available when your device is operating in station or point-to-point slave mode.
- The local web UI will be still accessible from the wired ports when data VLAN is enabled, unless management VLAN is enabled. Also, you can set management VLAN to 1 if you wish for the device's management IP to be accessible over the native network instead of the data VLAN network.
Here's an example of how a station and the devices connected to it will get an IP address assigned when operating without VLANS (Station A), with data VLAN (Station B), and with both data and management VLAN enabled (Station C):

/Device management & VLANs/Alternative local IP

Enable alternative local IP: When this setting is enabled (which it is by default), a 169.254.1.1 IP address will be added on the data bridge. This IP is only accessible via the wired ports, and cannot be accessed over the wireless link. This setting can be disabled, and you can also change the IP address to another value in the 169.254.0.0/16 range.
This IP is similar to the data bridge static IP, except it's only accessible over the wired ports, and can be set even when management VLAN is not enabled.
In the case below, both management VLAN and data VLAN are enabled, as well as data bridge static IP and alternative local IP. You can see on the dashboard how the IPs are assigned to the management and data bridges:


/Interface Settings/General
MTU: Maximum transmission unit. This setting will apply to the wireless interfaces, ethernet ports, and management/local bridge. The minimum allowed value is 1280, and the max is 7900.
Bridge ageing time: Ageing determines the number of seconds a MAC address is kept in the FDB after a packet has been received from that address. Set to this 0 to disable ageing.
Max FDB entries: Set the maximum number of allowed FDB (forwarding database) entries allowed. Set this to 0 for an unlimited number (default). This will effectively limit the number of MAC addresses that can pass traffic via the ETH ports. This is useful for limiting the number of connected customer devices - for example, set this value to 1 to ensure only one customer router is plugged in.
Other notes:
- This setting is only visible when operating in station or point-to-point slave mode.
- This setting is not compatible with failover mode.

/Interface settings/Ethernet Port #0
Compatibility note: this setting was introduced in 1.15.0 for the TNA-303L and 1.12.2 firmware for the other TNA-300 series devices.
Enable Carrier Drop: Enable carrier drop on the ETH0 port.
When enabled, the system will down the ETH0 for the specified number of seconds whenever the 60GHz wireless link goes down or falls below the specified threshold.
Once ETH0 has been downed, it will not go down again until the 60GHz signal has returned to normal operation. It is not required for anything to be plugged into the ETH0 port for the carrier drop service to run.
The startup delay determines how long the service will wait after boot up to begin monitoring the link

/Interface settings/Ethernet Port #1
Compatibility note: this setting only applies to devices that have more than one ethernet port, e.g. not the TNA-303L.
Enable PoE Out: Enable or disable PoE out on the ETH1 1G interface. Please refer to the appropriate operating manual for more information about input and output power.
Disable data: Disable data over the ETH1 interface. This is useful if you need to power an external device via PoE out but do not want to allow data to pass over the link. Note: When data is disabled over ETH1, failover will no longer function.
Enable Failover: (only available in station or point-to-point slave modes, and when data VLAN is disabled). Enable failover/backup over a device connected to the ETH1 port. Please refer to the TNA-300 series failover FAQs article for more information about the TNA failover/backup mechanism.
! Warning: Make sure to enable failover BEFORE you connect the network cable to your failover device connected to ETH1 in order to prevent network loops.
RSSI Threshold: The wireless signal threshold (remote or local) at or below which the device will switch into failover mode. Note: remote RSSI will not be checked when threshold is lower than -68.
Flap Protection Time: The amount of time in seconds to wait before switching back to normal operation once the wireless link RSSI has moved back into the normal range. Once this happens and the flap timer countdown has begun, the flap timer will be reset if at any time the RSSI drops back below the threshold during the countdown.

Failover status can be viewed on the dashboard, under the ETH1 widget, and is also accessible over SNMP and the RESTful API.

/Other settings/LLDP Forwarding
Compatibility note: this feature is available in firmwares v1.15.0 and later.
LLDP Passthrough: When enabled, the WAN bridge will forward LLDP frames instead of dropping them. This feature enables forwarding of both the nearest bridge (01:80:C2:00:00:0E) and nearest non-TPMR bridge (01:80:C2:00:00:03) multicast addresses.

/Other settings/Traffic control
Compatibility notes:
- Traffic Control settings are only visible when operating in station or point-to-point slave modes.
- This setting is not operational for the TNA-303L on firmwares prior to the final 1.12.2.
- These settings are available in firmwares v1.11.1 and later for all other TNA-300 series models.
Limit upload rate: Enable or disable traffic shaping on the upload (wireless) path, and set upload or download limit in Mbps.
Limit download rate: Enable or disable traffic shaping on the download (ethX) path, and set upload or download limit in Mbps.

/Other settings/DHCP snooping
Compatibility note: support for the additional DHCP options mentioned above were added in v.1.12.0 firmwares.

Note: DHCP Snooping settings are only visible when operating in station or point-to-point slave modes.
Block rogue DHCP servers: When this setting is enabled, DHCP discovery packets are dropped at the Station before being passed downstream*, and DHCP offer packets are dropped at the Station before being passed upstream.
Rogue DHCP servers can occur when a user plugs their router in backwards, exposing the DHCP server to the upstream WAN network, instead of to their local network.
Enable DHCP Option 82 Injection: Enable this setting to inject DHCP Option 82 fields into upstream DHCP request packets. You can choose to populate the Remote ID field, the Circuit ID field, or both.
These fields can be set to one of the following options:
- Station's wireless MAC: Insert the stations's wireless MAC address into the specified DHCP option 82 field. When the MAC address is inserted, it will be ASCII encoded, and will include the colons. If the "append null terminator" option is selected, a trailing null terminator character will be attached to the end of the string. The station MAC, 78:5e:e8:d0:00:02 would show up on the DHCP server as 37:38:3A:35:65:3A:65:38:3A:64:30:3A:30:30:3A:30:32:0 with the null terminator, and 37:38:3A:35:65:3A:65:38:3A:64:30:3A:30:30:3A:30:32 without it.
- Custom: Insert an ASCII string of your choice (such as a customer's ID number or phone number) into the specified option 82 field. The string must be between 1 and 64 characters. The string will be hex encoded and include a null terminator character at the end if the "append null terminator" setting is enabled. For example, the string "Tachyon127" will appear on the DHCP server as: 54:61:63:68:79:6f:6e:31:32:37:0 with the null terminator appended, or 54:61:63:68:79:6f:6e:31:32:37 without it.
- None: don't insert anything into the specified option 82 field
Additional options:
- Append null terminator: this option allows to to add or remove a trailing 0x0 character from the DHCP option string. When the option to append the eth port (see below) is enabled, no null terminator will be appended to the string. In previous firmwares, this was the default. You may want to disable this setting if your DHCP server isn't parsing the DHCP option value correctly.
- Append eth port: When this option is enabled, a label will be appended to the end of the remote or circuit ID indicating which ethernet port the client is connected behind (eth0 or eth1). For example, if the circuit ID is set to "we love tachyon", the resulting ID in the DHCP lease for a client connected behind eth1 will show up as "we love tachyoneth1".
Any DHCP requests that come from devices connected to the TNA radio over the wired ports, as well as from the station device itself, will be injected with the DHCP option 82 fields.
Terminology
- Upstream indicates traffic over the uplink, from the Station to the Access point.
- Downstream indicates traffic originating at the station, moving down stream to any devices connected to the wired ports.
60GHz Wireless Settings
! Warning: Most changes (except as noted below) to wireless settings will cause a full networking restart, and all wireless peers will be disconnected.
Wireless mode: Choose whether you'd like your device's 60 GHz radio to operate in access point, station, point-to-point master, or point-to-point slave mode.
When point-to-point modes are enabled, only a single peer connection will be allowed, and the link is optimized for point-to-point performance.
Note: if you change operating modes, your device will require a reboot to take effect.
Channel Width: Full (2 GHz) or Half (1 GHz). Please read these important notes about half channel support. Warning: if you change channel widths, your device will require a reboot to take effect.
Channel: The available non-overlapping channels for the full 2 GHz channel width are 1-6. For half channel, 12 channels are supported, and broken up by high and low: e.g. 1-low, 1-high, 2-low, 2-high, etc...
When changing the AP's channel in firmwares v1.12.1 and later, CSA (channel switch announcement) support has been added to allow clients to change channels more seamlessly without having to disconnect and reconnect on the new channel.
Note: In firmwares earlier than v1.12.0, half channel numbering was 1-11. The half channel center frequencies were adjusted in the 1.12.0 firmware.
Max MCS: Data rates are dynamically selected, but you can choose to set the max MCS allowed.
- When half channel support is enabled, the max MCS allowed is MCS 9.
- Setting max MCS only affects the TX MCS rate of the current device. To set MCS for both TX And RX, you must change the max MCS value on both the AP and station sides of the link.
SSID: The radio's SSID/network name.
Security mode: Select link encryption - either open or AES+GCMP.
Antenna kit: Select the antenna kit that's attached to your device. This field is only available for TNA-303X models. Changing this setting will not cause the station to disconnect and reconnect.
Lock to boresight: When an antenna kit is selected on a TNA-303X operating in PTP or station modes, you can choose to lock the radio to the boresight beam. This may allow you to more easily fine tune the link as it will keep the radio from beamforming and jumping to a different sector while you aim. Changing this setting will not cause the station to disconnect and reconnect.

Station profiles
When your device is set to operate in station (aka client) or point-to-point slave mode, additional options will be shown in the UI that allow you to input multiple connection profiles. The client will connect to the SSID/profile with the highest priority first.
Priority: The priority of the profile. 1 is the highest priority, and 10 is the lowest. When you define multiple profiles with the same priority, the device will connect to the SSID that has the better signal.
SSID: The SSID for the connection profile.
Security: Security mode and passphrase that should be used when connecting to the specified AP.
Enable sorting: You may want to check this box to disable sorting of the profiles table while inputing profiles to keep the entries from jumping around as you change profile priorities.
These settings are available in v1.11.2+ firmwares and later.

2.4GHz Wireless Settings
If your TNA model supports a management radio, the 2.4GHz radio configuration will be available on a tab on the Wireless configuration page. For models that support a USB-powered radio, the 2.4GHz settings can be configured even when the radio is not present, and will take affect after the USB is inserted.
By default, the 2.4GHz radio SSID is set to tachyon-mgmt-<the last 3 octets of the ETH0 MAC>.

Services Settings
/HTTP
The settings in this section refer to the local webserver running on the device.
Disable Insecure HTTP: Disable HTTP and only allow HTTPS connections to your device's configuration UI and API.
Port: HTTP port at which you can access the local web UI. Default is 80.
HTTPS port: HTTPS port at which you can access the local web UI. Default is 443.
Note: the SSL certificate for the device's web server is a dynamically generated self-signed certificate. Some modern web browsers (such as Chrome) no longer accept self-signed SSL certificates by default. In order to view the HTTPS version of the web interface, you will need to use a browser that allows self-signed certificates, such as FireFox.
Restart webserver: Click this button to restart the device's web server. This action takes affect immediately and will cause the web server to be down a few seconds. This is a work around to fix the rare cases when the application web sockets become unresponsive (this may happen during aiming, speed tests, or when fetching live stats on the dashboard).

/NTP
Enable: Enable or disable the NTP (network time protocol) server. This server is enabled by default.
Server addresses: A list of NTP peers that the device should use when updating the local time.

/Device discovery
Enable: Enable or disable the device discovery service for this device.
Discovery nearby devices:
Enable the LLDP (Link Layer Discovery Protocol) server in order to find nearby devices on the network. Nearby devices can be found by using the Device discovery tool on the Tools page.
Broadcast device info:
Allow this device to be discoverable over LLDP (Link Layer Discovery Protocol), CDP (Cisco Discovery Protocol), and/or MNDP (Mikrotik Neighbor Discovery Protocol).

MNDP Tools
Go here to read about utilities that allow you to view Tachyon (and other MNDP-enabled) devices on your network.
/SNMP
Enable: Enable the local SNMP server. The SNMP server is disabled by default. The private MIB for the TNA-300 series devices can be found here.
Use hardware uptime value: When enabled, the sysUpTime value (OID .1.3.6.1.2.1.1.3) will use the device's hardware uptime, instead of the uptime of the internal SNMP server. The SNMP server is restarted whenever any related fields are changed (such as SNMP server-related settings as well as device name, location, etc). This option is disabled by default.
Protocol: Choose SNMP version: SNMPv2, SNMPv3, or dual SNMPv2 + SNMPV3.
Community (SNMPv2 only): Input the community string for the SNMP server. The default value is public.
User (SNMPv3 only): SNMPv3 authentication username. Length must be between 1 and 100 characters.
Password (SNMPv3 only): SNMPv3 SHA+AES authentication passphrase. Length must be between 8 and 32 characters.
Encryption (SNMPv3 Only): SNMPv3 encryption and authentication algorithms. The default is AES-128+SHA-1 and AES-256+SHA-156 was introduced in v1.15.0 firmware.
Here's an example demonstrating how to fetch the device's current 60GHz channel using SNMPv3 and snmpwalk:
> snmpgetnext -v 3 -u <user> -A <password> -X <password> -a SHA -x AES -l authPriv <device ip> 1.3.6.1.4.1.57344.1.2.2.1.4

SNMPv2-SMI::enterprises.57344.1.2.2.1.4.1 = INTEGER: 1
Here's an example using the new encryption method:
> snmpgetnext -v 3 -u <user> -A <password> -X <password> -a SHA-256 -x AES-256 -l authPriv <device ip> 1.3.6.1.4.1.57344.1.2.2.1.4

SNMPv2-SMI::enterprises.57344.1.2.2.1.4.1 = INTEGER: 1
Note: system default versions of Net-SNMP CLI tools may not have native support for AES-256 and SHA-256 options.

/SNMP traps
Enable: Enable or SNMP traps to be sent from this device. These match up to the device's events shown on the activity page.
User: The username that should be included when connecting to the server specified below. If no username is required, just use a dummy value here such as "nonya".
Server address: Hostname or IP of the SNMP trap receiver.
Port: Port of the SNMP trap receiver. Default is 162.
Protocol: Choose the trap version: SNMPv2 or SNMPv3
Community (SNMPv2 only): Community string for SNMPv2.
Password (SNMPv3 only): Password used for SNMPv3.

Once enabled, traps will be pushed to your trap server, like shown in the iReasoning MIB browser example screenshot below:

Notes:
- The MIB that contains the Tachyon trap definitions can be found in the TNA-300 Series Private MIB article.
- Because of the nature of SNMP traps, some events might be lost before they reach your trap server. For example, client association traps are sent at association time, which could occur before the upstream data path is completely initialized, causing the trap message to be dropped.
/Ping watchdog
This service pings the specified IP address at the given interval and reboots the device after receiving a certain number of failures in a row. This service is disabled by default.
Enable: Enable the ping watchdog service.
Ping interval: How long the service should wait, in seconds, between attempts to ping the provided IP.
Startup delay: The length of time in seconds that the service should wait until it attempts the first ping.
Failure count: The maximum allowed number of failures allowed (in a row) before the device will be rebooted.
IP address to ping: The IP address that the service will attempt to ping.

/Remote syslog
Enable: Enable or disable the remote syslog service.
Protocol: Remote syslog server protocol: TCP or UDP
Server address: IP address or hostname of the remote syslog server.
Port: Port at which the remote syslog server is running.
Start advanced wireless logging: Click this button to immediately turn on (or to turn off) advanced wireless driver logging. This will result in extremely verbose logs (as well as reduced performance) and should only be turned on when requested by a Tachyon support tech. This option is only available once remote syslog is enabled and running.

System Settings
/Device information
Device name: The name of this device. This field is used to populate the system name field used in the device discovery tool.
Device location: The physical location of this device. This free-form field is not used internally by the system, and can be set to whatever you'd like.
Latitude: The latitude in decimal degrees of the device. 0 is default.
Longitude: The longitude in decimal degrees of the device. 0 is default.
Country: Select the country where this device will be used. The country field is used to set local regulatory rules.
Hostname: The system hostname of your device. This must be a valid hostname format and only contain alphanumeric characters, periods and dashes, and must start or end in an alphanumeric character.

/Time settings
Compatibility note: This section is not applicable to the TNA-303L, where all times are represented in UTC.
Enable advanced timezones: Select this box to enable timezones that have DST support enabled.
Time zone: The timezone that should be used for this device's time.
Date/time: Use the date and time fields to manually set the device's local date and time. If NTP is enabled, you will not be able to manually set the date and time.

/Other settings
Physical reset button: Enable or disable the physical reset button.
LED signal comparison method: For station mode, the signal LED(s) on the device indicate the station's status and connected signal (please refer to your specific model's operating manual for these LED definitions). By default the signals are based off of a fixed range of RSSI values, but you can change this as of firmwares 1.12.1 and later to be relative to the station's target RSSI instead. When this value is set to "Target RSSI", and target RSSI is not available or is invalid, the device will fallback to the "Fixed" option.
! Warning: It is not recommended that you disable the device's physical reset button. Misconfigurations could make the device become unreachable.

Authentication
Compatibility note: RADIUS support was added in firmware v1.12.0.
The System Authentication page gives you control over access to your device via the web UI and RESTful API.
There are two methods available for system authentication:
- Local user list: This is the default authentication method and will authenticate API and web UI users according credentials configured in the user list. (Read more below about user roles).
- RADIUS auth: This method allows web UI users to be authenticated against an external RADIUS server. The system activity log will indicate the authentication method used when a login attempt is made. Some notes about this method:
- API users are still authenticated against the local user list.
- All users authenticated over RADIUS will have their role set to admin.
- If the configured RADIUS server is unavailable, or if the shared secret is mis-configured, then the local users list will be used as a fallback.

- API users are still authenticated against the local user list.
There are currently two roles for a user when using the local user list authentication option:
- Admin: Full access to all settings in the Web UI and all RESTful API routes.
- Read-only: Limited access to the Dashboard page of the web UI only, and API routes that don't affect operation of the device, such as fetching device stats.

Password requirements
- Passwords must be between 5 and 32 characters long.
- As of firmware v1.11.0, you may use a subset of special characters in your user passwords.
- As of firmware v.1.11.2, you may use the following special characters: !@#$%^&*()?.><,~+_-/
System and device actions
You can find the system actions by clicking the gear icon located on the top right side of the page:

/Upgrade firmware
Select this option to upgrade or downgrade your device's firmware.
Please follow the firmware upgrade best practices listed at the end of this section.
If after an upgrade attempt your device is running a previous version of firmware, it's possible that it failed to boot using the new firmware, and fell back to the previously working bootbank.
In this case, please contact support to verify you have a valid firmware image. If there was a power interruption or flicker during the upgrade, it's safe to retry the firmware upgrade assuming the device's input power is stable.
If you're downgrading your device's firmware, make sure to select the "Reset config after device update" option, shown below:

! Warning: Do not unplug or reboot your device while firmware upgrade is in progress!
Firmware upgrade best practices
- Review Release Notes: Always read the firmware release notes before upgrading. They may contain important information about version-specific changes or potential incompatibilities.
- Reboot Before Upgrade: It is recommended to reboot your device before performing a firmware upgrade. This is especially important for devices that have been running for extended periods of time or are under heavy load, especially in cases where a new firmware upgrade is addressing a memory leak.
- Upgrade Only When Needed: If your device is functioning normally and the new firmware does not include critical bug fixes, security updates, or features you require, upgrading is not necessary.
- Upgrade Order: When upgrading a PTMP scenario, you should always upgrade stations first, and then the APs. For PTP, upgrade the slave side before the master.
- Version Consistency: Ensure all APs and stations (or PTP master and slave units) are running the same firmware version to maintain compatibility and optimal performance.
- Firmware downgrade: If downgrading firmware, it is recommended that you reset to defaults (an option available during the upgrade/downgrade process) in order to ensure no configuration incompatibilies.
/Config backup & restore
You can easily backup or restore a device's internal configuration settings from the Backup configuration dialog.
The config is exported in a compressed format, which should never be manually edited.
It is recommended that you reboot your device after importing a device's config from a backup file.

! Warning: Is it currently not supported to restore the config of a device operating in AP mode on a device operating in Station or point-to-point slave modes, or visa versa. If you do so, you must reboot the device afterwards.
/Reboot
Reboot your device immediately.
/Reset device
Reset your device to factory defaults. You may want to reset your device if downgrading to an older firmware.
/Fetch troubleshooting file
Fetch an archive of log files, configuration files, stats, and other information useful in troubleshooting any issues with the Tachyon support team.
Tools
/Aiming
The basic Aiming tool can currently be used to give you RSSI signals at a faster rate than you can see on the device's dashboard. This tool is only available when operating in station or point-to-point modes. As of firmware v1.12.2+, aiming duration time, in seconds, can be set. By default, duration is set to 5 minutes.
Note: In the event that aiming becomes unresponsive, please click the "restart webserver" button under the Configuration->Services->HTTP server section.
To view the aiming data in full screen mode, click the "fullscreen" icon next to the Aiming header.

You can also temporarily set the station's channel to a static value using the "Additional options" below the aiming tool. This is useful to reduce scanning time when the channel of the AP is already known at setup time.
Auto-channel can be re-enabled by clicking "Cancel", or the station will automatically reset back to auto-channel after a period of 20 minutes (this will cause the station to temporarily disconnect and reconnect). Changing any other wireless settings on the wireless configuration page will result in the cancellation of the static channel change as well.

/Site Survey
Use the site survey tool in order to view a list of other Tachyon 60GHz APs broadcasting in the nearby area. This tool is only available when operating in station or point-to-point slave modes.
! Warning: Running a site survey scan will temporarily cause your radio to become unreachable. It will come back automatically when scanning is complete.

/Ping
Perform a basic ping IPv4 or IPv6 operation from the device.

/Traceroute
Perform a basic traceroute operation from the device.

/View log
Search and view the device's logs. The contents of the logs may vary slightly depending on device model.
As of firmware 1.15.0, there are now two options:
- Log option 1: This is dmesg output (which was previously shown in other firmwares). The timestamp shown is the number of seconds since boot.
- Log option 2: This is the contents of /var/log/messages which uses the device's system time as a timestamp.
Output from logread can also be read from the console or via one of the remote syslog options.


/Device discovery
Use the device discovery tool to find other devices on your network.
! Note: You must have Device Discovery enabled under the Configuration >> Services >> Device discovery settings page in order for your device(s) to be discoverable.

System name and description can be set under your device's system settings located at Configuration >> System >> Device information:

/Bridge Table
Use the bridge table tool to view the MAC addresses in the device's bridge forwarding table, as well as their associated interface and bridge.

In the example above, these MACs are behind prs0 in the br-wan bridge.
/Sector Info Tool
The sector tool will allow you to visually see how each peer is connected to the current device (the orange dot), which can help you determine how close connected peers are to boresight.
You can read more about TNA-300 series antenna sectors in order to get a better understanding about what the sector IDs represent.
Notes:
- Sector info isn't currently available when an antenna kit is selected
- The red "X" denotes boresight for the device particular model.
- When you click on a connected peer's sector ID from the dashboard, you will only see that individual sector on the sector tool. You can click the "View all" button to view all connected peers.
- When multiple peers are connected on the same sector, the point will grow larger, a list of up to the first 3 devices connected on that sector will be shown.
- It's possible for a peer to be connected on different sectors for RX and TX. When this happens, a peer will be represented by two dots, each with a "(RX)" or "(TX)" label following the peer's name, like this:


Activity
Recent events, such as client association/disassociation, user login, DHCP events, etc can be found under the Activity page, or by clicking the calendar icon in the top right nav area.

